-
 Thanh toán đa dạng, linh hoạtChuyển khoản ngân hàng, thanh toán tại nhà...
 -
 Miễn Phí vận chuyển 53 tỉnh thànhMiễn phí vận chuyển đối với đơn hàng trên 1 triệu
 -
 Yên Tâm mua sắmHoàn tiền trong vòng 7 ngày...
Fullstack D3 and Data Visualization: Build beautiful data visualizations with D3
-
- Mã sản phẩm: 0991344650
- (30 nhận xét)


100% Hàng chính hãng
Chính sách Đổi trả trong vòng 14 ngày
Kiểm tra hàng trước khi thanh toán
Chưa có nhiều người mua - cẩn thận
- Publisher:Fullstack.io (July 29, 2019)
- Language:English
- Hardcover:608 pages
- ISBN-10:0991344650
- ISBN-13:978-0991344659
- Item Weight:3.56 pounds
- Dimensions:7.5 x 1.81 x 9.25 inches
- Best Sellers Rank:#1,120,057 in Books (See Top 100 in Books) #292 in JavaScript Programming (Books) #3,540 in Programming Languages (Books) #4,803 in Internet & Social Media
- Customer Reviews:3.9 out of 5 stars 30Reviews
3,205,000 vnđ
-
+
Fullstack D3 and Data Visualization: Build beautiful data visualizations with D3
3,205,000 vnđ
-10%
(22 nhận xét)
- Ngăn chặn quá trình oxy hóa của da
- Ngăn ngừa hắc sắc tố melanin (nám) của da.
- Ổn định nội tiết tố ngăn ngừa xạm da do nội tiết.
- Loại bỏ các tế bào hắc sắc tố melanin của da, làm giảm nguy cơ xạm da từ trong cơ thể, trị sạm, nám
- Giúp cải thiện chức năng gan, giải độc cơ thể và tăng cường hệ miễn dịch.
545,000đ
605,000 đ
-10%
(1 nhận xét)
- Bổ sung chất xơ, giúp cân bằng hệ vi sinh đường ruột, tăng cường lợi khuẩn có lợi cho hệ tiêu hóa.
- Giúp hệ tiêu hóa thải các chất độc tố ra khỏi cơ thể hiệu quả.
- Hỗ trợ cải thiện tốt các bệnh lý về đại tràng như: viêm đại tràng co thắt (hội chứng ruột kích thích/ rối loạn chức năng đại tràng), viêm đại tràng giả mạc, viêm loét đại tràng,
- Cải thiện các triệu chứng rối loạn tiêu hóa như: bệnh táo bón, khó tiêu, tiêu chảy,...
- Giúp tái tạo niêm mạc đại tràng, tăng cường sức khỏe đường tiêu hóa, từ đó tăng cường hệ miễn dịch cho cơ thể.
207,000đ
229,000 đ
-10%
(0 nhận xét)
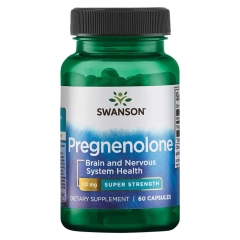
- Viên uống giúp giảm stress, giảm lo âu, chống trầm cảm.
- Giảm tình trạng và tần suất của chứng đau nửa đầu.
- Cân bằng cảm xúc, cải thiện tâm trạng, giúp bạn bình tĩnh hơn.
- Hỗ trợ hệ thần kinh khỏe mạnh, phòng ngừa suy nhược thần kinh.
- Cải thiện chất lượng giấc ngủ, giảm tình trạng mất ngủ.
567,000đ
630,000 đ
-10%
(2 nhận xét)
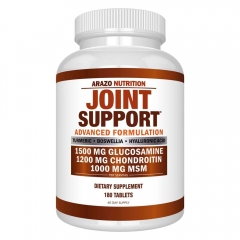
- Tăng cường sức khoẻ, sự bền bỉ của cấu trúc xương khớp
- Ngăn chặn sự phá huỷ của các enzym đối với sụn khớp.
- Làm chậm quá trình lão hoá khớp xương và sụn.
- Cung cấp Glucosamine và Chondroitin cho xương, sụn, khớp.
- Bổ sung chất bôi trơn cho khớp và lớp đệm của sụn.
- Giúp các khớp và xương vận động linh hoạt, dễ chịu.
- Cải thiện được các chứng đau nhức xương khớp, viêm khớp.
689,000đ
765,000 đ
-10%
(2 nhận xét)
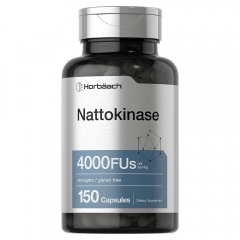
✔ Phòng ngừa và hỗ trợ điều trị tai biến mạch máu não, đau thắt ngực.
✔ Bổ tim mạch và ngăn nừa đột quỵ
✔ Hỗ trợ điều trị bệnh tăng giảm huyết áp.
✔ Tăng cường tuần hoàn não và lưu thông máu.
✔ Tăng cường sinh lực, cải thiện tình trạng mệt mỏi và suy giảm trí nhớ ở người cao tuổi
500,000đ
555,000 đ
-10%
(1 nhận xét)
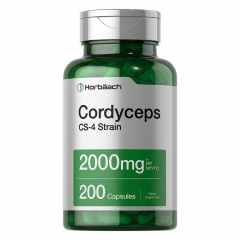
- Bổ phổi, đặc biệt tốt cho người bị viêm phổi phế quản mãn tính giảm nguy cơ mắc bệnh hen và các vấn đề về đường hô hấp.
- Giúp bồi bổ cơ thể, hỗ trợ ăn ngon, ngủ khỏe, tăng cường tuổi thọ.
- Tăng cường khả năng sinh lý ở nam giới.
- Làm giảm huyết áp và tăng cường quá trình lưu thông máu.
- Hỗ trợ sức khỏe tim mạch khỏe mạnh.
405,000đ
450,000 đ
-10%
(0 nhận xét)
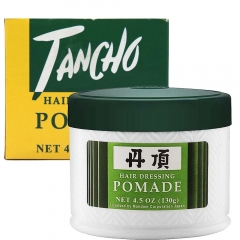
- Khả năng giữ nếp tốt
- Không bị vón cục
- Không gây nhờn rít
- Phù hợp sáng tạo với mọi loại kiểu tóc.
- Khô nhanh và tạo cảm giác bồng bềnh tự nhiên và dễ dàng chỉnh sửa kiểu tóc bằng tay
531,000đ
590,000 đ
-10%
(0 nhận xét)
- Hỗ trợ điều trị mất ngủ
- Giúp ngủ sâu, ngủ nhanh và êm dịu
- Tăng sức đề kháng
- Tăng cường hệ miễn dịch
189,000đ
210,000 đ
-10%
(2 nhận xét)
- Lợi tiểu, giảm đau nhanh, chống co thắt, chống viêm, kháng khuẩn.
- Làm giảm sự phù nề của niệu quản, tạo điều kiện thuận lợi cho sỏi di chuyển xuống dưới và thải ra ngoài.
- Ngưng sự gia tăng kích thước của hòn sỏi, đồng thời hòa tan sỏi từ từ.
- Ngăn ngừa sự hình thành sỏi từ mầm mống ban đầu, bào mòn, phá vỡ sỏi cũ và tống chúng ra ngoài, ngăn ngừa tái phát sỏi.
- Giúp giảm sự đau đớn khi sỏi di chuyển và ngăn ngừa các biến chứng nhiễm khuẩn do sỏi gây ra.
576,000đ
640,000 đ
-10%
(0 nhận xét)
- Giúp giảm cảm giác thèm đường, ức chế vị ngọt, ngăn chặn các thụ thể đường trên vị giác của bạn.
- Giúp hạ đường huyết, giảm sự hấp thu glucose của đường, kiểm soát lượng đường huyết trong máu.
- Kích thích sản xuất insulin trong tuyến tụy, thúc đẩy tế bào sản xuất insulin, từ đó giúp giảm lượng đường trong máu.
- Hỗ trợ tăng cường chức năng trao đổi chất khỏe mạnh.
- Giúp hạ cholesterol xấu và chất béo trung tính, làm giảm nguy cơ mắc các bệnh về tim mạch.
176,000đ
195,000 đ
(7 nhận xét)
- Bổ sung các dưỡng chất cần thiết giúp dưỡng não, bổ não, cải thiện sức khỏe não bộ tốt hơn mỗi ngày.
- Giúp tăng cường tuần hoàn máu não, phá vỡ các cục máu đông giúp lưu thông máu lên não một cách bình thường.
- Tăng cường trí nhớ và khả năng tập trung, từ đó giúp tăng hiệu suất làm việc.
- Có hiệu quả giúp giảm stress, căng thẳng, đau đầu, đau nửa đầu.
990,000đ
990,000 đ
-10%
(3 nhận xét)
- Giúp tăng cường hệ thống miễn dịch của cơ thể.
- Tăng cường và cải thiện trí nhớ cải thiện chức năng não bộ hoạt động tốt hơn.
- Giảm căng thẳng thần kinh, giảm stress, cải thiện tâm trạng.
- Ngăn ngừa trầm cảm, giảm triệu chứng tâm thần phân liệt.
- Giảm tình trạng bốc hỏa, căng thẳng ở phụ nữ tiền kinh nguyệt, tiền mãn kinh, mãn kinh.
- Hỗ trợ cải thiện bệnh viêm khớp dạng thấp và bệnh tự miễn.
- Giúp tăng cường trí nhớ cho người lớn tuổi.
270,000đ
300,000 đ
-10%
(41 nhận xét)
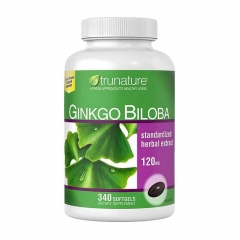
- Cải thiện trí nhớ, tăng cường tập trung duy trì tinh thần tỉnh táo.
- Hỗ trợ cải thiện hiện tượng thiếu máu não, tăng cường và phục hồi sức khỏe não bộ.
- Hỗ trợ điều trị những người bị di chứng tai biến mạch máu não và chấn thương sọ não.
- Ginkgo Biloba 120mg có khả năng phòng ngừa và làm chậm tiến triển của bệnh Alzheimer's (bệnh giảm, sa sút trí nhớ ở người cao tuổi từ đó gây ra tình trạng rối loạn trí nhớ, lú lẫn, giảm khả năng trí tuệ và rối loạn trong hành vi và cư xử).
- Ngăn chặn, hỗ trợ làm giảm tình trạng thoái hóa võng mạc, tuần hoàn ở mắt, tai mũi họng và rối loạn thần kinh cảm giác.
419,000đ
465,000 đ
-10%
(44 nhận xét)
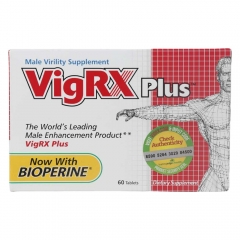
- Hỗ trợ tăng kích thước và chiều dài dương vật
- Cải thiện sự cương cứng và cực khoái trong quan hệ tình dục
- Cải thiện tiết hormon tình dục nam
- Quan hệ tình dục khỏe mạnh và dẻo dai hơn
932,000đ
1,035,000 đ
-10%
(32 nhận xét)
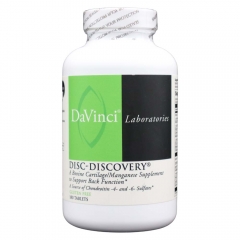
- Cung cấp dưỡng chất, vitamin và chất khoáng, giúp phục hồi, tái tạo và nuôi dưỡng mô sụn, đĩa đệm.
- Hỗ trợ điều trị các triệu chứng thoát vị đĩa đệm, thoái hóa cột sống.
- Giảm các triệu chứng đau lưng, gai cột sống do thoái hóa.
- Viên uống Davinci Disc-Discovery tăng độ co giãn, đàn hồi cho các cơ, mạch máu, phòng ngừa tổn thương mới do thoái hóa cột sống, thoát vị đĩa đệm gây ra.
- Kích thích collagen tu sửa mô tế bào trong cơ thể, cải thiện hệ thống miễn dịch đồng thời giữ gìn sự toàn vẹn của mạch máu và trong hô hấp tế bào.
- Thích hợp với những người đang điều trị hoặc có nguy cơ mắc thoát vị đĩa đệm, thoái hóa cột sống.
1,080,000đ
1,200,000 đ
-20%
(0 nhận xét)
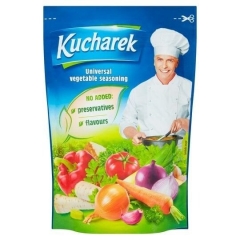
- Chiết xuất từ 11 loại RAU CỦ QUẢ được trồng bằng phương pháp HỮU CƠ cực kỳ thơm ngon, an toàn cho bé ăn dặm và cả gia đình.
- KHÔNG CHẤT BẢO QUẢN, KHÔNG CHỨA CHOLESTEROL nên dùng được cho cả người huyết áp cao, máu nhiễm mỡ.
- Bổ sung lượng vitamin cần thiết cho cơ thể
- Hạt nêm mềm, mịn, có vị thanh ngọt, nêm nếm vào các món nấu, hầm, xào đều rất ngon
- Dùng được cả cho món chay và món mặn, giúp món ăn trở nên tròn vị và dậy mùi hơn.
40,000đ
50,000 đ
-20%
(0 nhận xét)
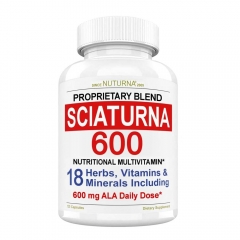
- Bổ sung các vitamin, khoáng chất thiết yếu rất tốt trong việc hỗ trợ cải thiện sức khỏe xương khớp.
- Sciatica có hiệu quả giúp hỗ trợ làm giảm các triệu chứng của đau thần kinh tọa.
- Giúp tăng cường sức khỏe xương khớp, giúp các khớp xương vận động dẻo dai, linh hoạt hơn.
- Hỗ trợ ngăn ngừa và cải thiện các bệnh lý về xương khớp như vi.êm khớp, đau khớp, cứng khớp,...
- Làm giảm các triệu chứng như đau lưng, hông, đùi, chân, bàn chân.
684,000đ
855,000 đ
-49%
(0 nhận xét)
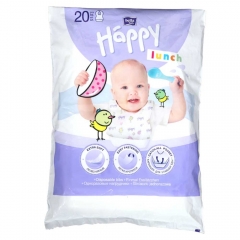
- Thiết kế đặc biệt khác với các loại yếm thông thường là máng hứng thức ăn rơi vãi của bé, giảm thiểu việc quần áo bé bị vấy bẩn, lem nhem, không thẩm mỹ.
- Giúp bé có thể tập ăn một cách thoải mái và gọn gàng hơn.
- Giảm thiểu nỗi lo của các bật phụ huynh trong những ngày tập ăn cho bé.
18,000đ
35,000 đ
-50%
(0 nhận xét)
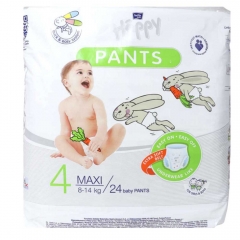
- Bé có thể thoải mái tự do vận động nhờ có dây thắt lưng co giãn, có thể điều chỉnh phù hợp ôm vào cơ thể của bé, không gây tuột hay lệch tả.
- Chất liệu vải không dệt giúp hấp thụ chất thải lỏng nhanh chóng giữ cho bé luôn được khô thoáng .
- Bé có thể tự do vận động nhờ có sự co giãn linh hoạt của miếng lót y tế.
- Nhờ công nghệ Airflow có khả năng trao đổi khí và thân thiện với làn da nhạy cảm của bé
- Đồng hành cùng bé từ tư thế nằm, lăn sang bò và ngồi, đến lúc bé dần dần trở nên cứng cáp hơn để đứng vững trên đôi chân non nớt của mình và tập đi.
60,000đ
120,000 đ
-49%
(0 nhận xét)
- Bé có thể thoải mái tự do vận động nhờ có dây thắt lưng co giãn, có thể điều chỉnh phù hợp ôm vào cơ thể của bé, không gây tuột hay lệch bỉm của bé
- Chất liệu vải không dệt giúp hấp thụ chất thải lỏng nhanh chóng giữ cho bé luôn được khô thoáng .
- Bé có thể tự do vận động nhờ có sự co giãn linh hoạt của miếng lót y tế.
- Nhờ công nghệ Airflow có khả năng trao đổi khí và thân thiện với làn da nhạy cảm của bé
28,000đ
55,000 đ


Copyright ©2024 muathuoctot.com. All Rights Reserved
 KHUYẾN MÃI LỚN
 Đông Trùng Hạ Thảo
 Hỗ Trợ Xương Khớp
 Bổ Não & Tăng cường Trí Nhớ
 Bổ Sung Collagen & Làm Đẹp
 Bổ Thận, Mát Gan & Giải Độc
 Chăm Sóc Sức khỏe Nam Giới
 Chăm Sóc Sức khỏe Nữ Giới
 Chăm sóc Sức khỏe Trẻ Em
 Thực Phẩm Giảm Cân, Ăn Kiêng
 Bổ Sung Vitamin & Khoáng Chất
 Bổ Tim Mạch, Huyết Áp & Mỡ Máu
 Bổ Mắt & Tăng cường Thị lực
 Điều Trị Tai Mũi Họng
 Sức Khỏe Hệ Tiêu hóa
 Chăm Sóc Răng Miệng
 Chống Oxy Hóa & Tảo Biển.